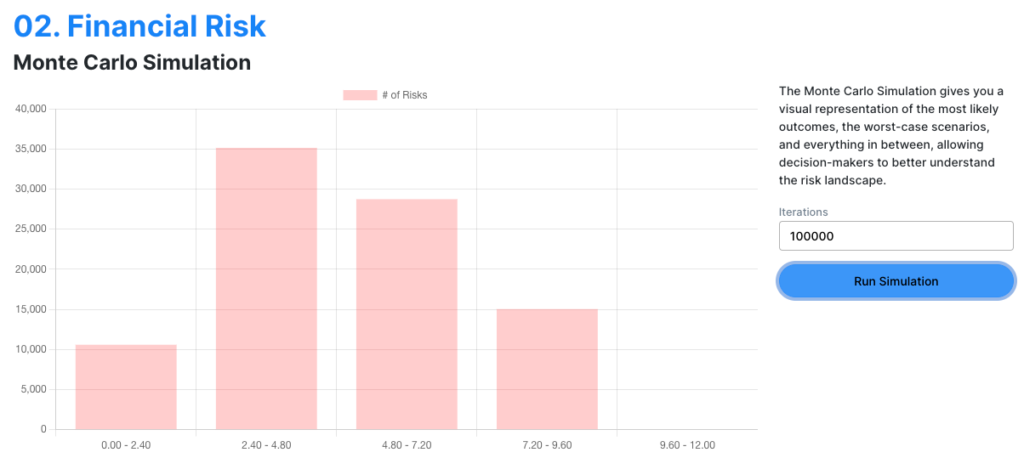
The Monte Carlo Simulation gives you a visual representation of the most likely outcomes, the worst-case scenarios, and everything in between, allowing decision-makers to better understand the risk landscape.
We have added the Monte Carlo simulation to the Risk Management tools in Copyl. We think that this simuation is best placed under a Risk Category. Select one of the Risk Categories to see all risks under it and the simulation result.
You can select how many iterations you want to see the histogram chart for.
How Monte Carlo simulation works with Risk Management
In each iteration, for each risk in the Risk Category, it checks if the risk occurs (based on a random number and the risk’s probability). If the risk occurs, its impact is added to a cumulative outcome for that iteration.
The x-axis represent bins of ranges of cumulative risk impact.
The y-axis represent the frequency of these cumulative impacts falling into each bin.
To break it down
- Individual Risk Impact: For each risk, you have a defined “impact” value (ranging from 1-5). In each iteration of the Monte Carlo simulation, a risk may or may not “occur” based on its probability.
- Cumulative Impact for One Iteration: During a single iteration of the simulation, you might find that Risk A, Risk C, and Risk E occur, but Risk B and Risk D do not. The “cumulative risk impact” for that iteration would be the sum of the impacts of Risk A, Risk C, and Risk E.
- Cumulative Impact Across Iterations: The Monte Carlo simulation runs many iterations to model the randomness and uncertainties. Each iteration will have its own “cumulative risk impact,” and you collect these into a list.
For performance reasons, each iteration is cached for 10 minutes.